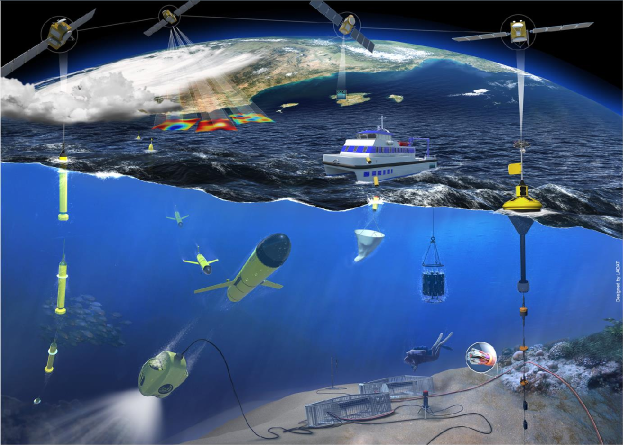
A multi-platform system with three major subsystems:
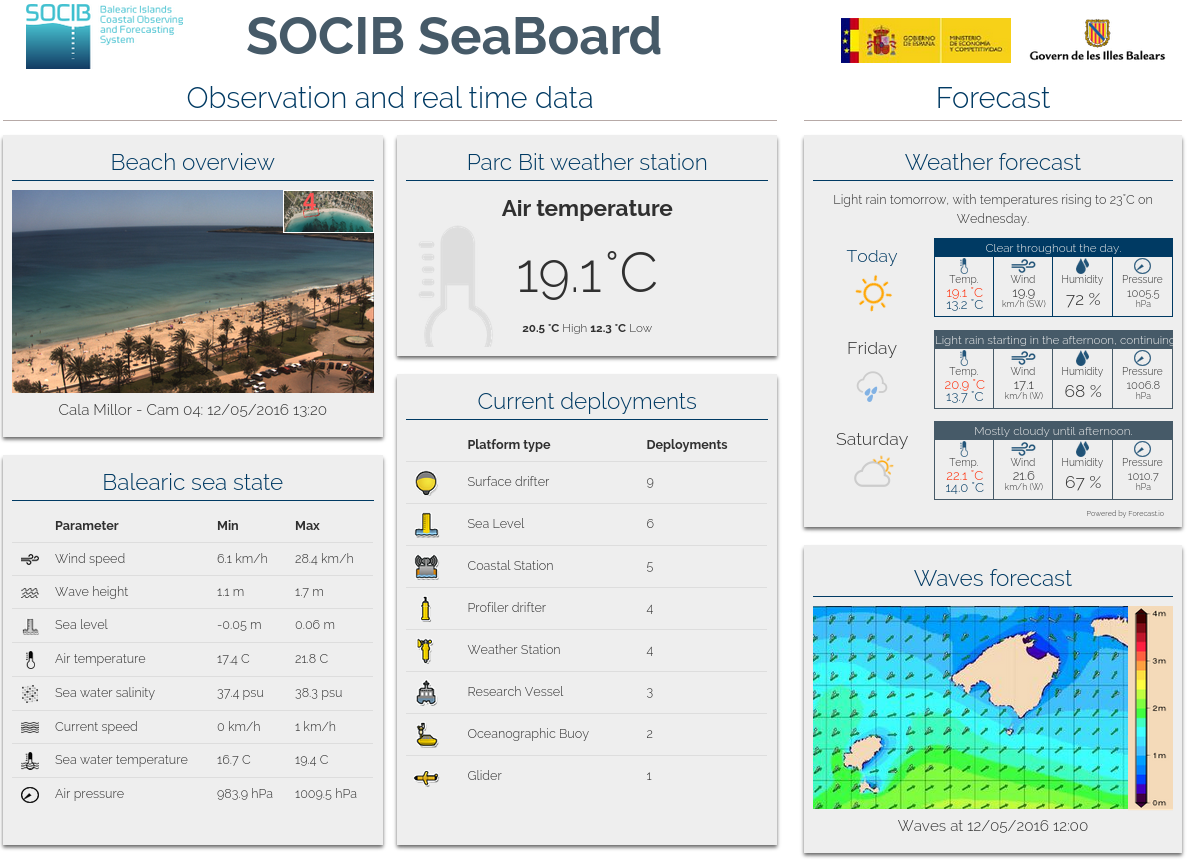
- Observing facilities: fixed stations such as oceanographic boys, coastal stations, weather stations and sea level stations. We also have a glider fleet, a mid-size research vessel, profiler drifters and surface drifters and an HF Radar station.
- The Forecasting and Modelling Facility: An ocean forecasting system representing currents, temperature, salinity and sea level in the western Mediterranean Sea; A meteo-tsunami forecasting system aiming at predicting the occurrence of meteo-tsunamis ("rissagues") in Ciutadella Harbor (Menorca); A wave forecasting system implemented around the Balearic Islands
- A Data Centre Facility: general data management system to guarantee international standards, quality assurance and inter-operability.
Scenario: THREDDS Data Server (TDS) + ncWMS
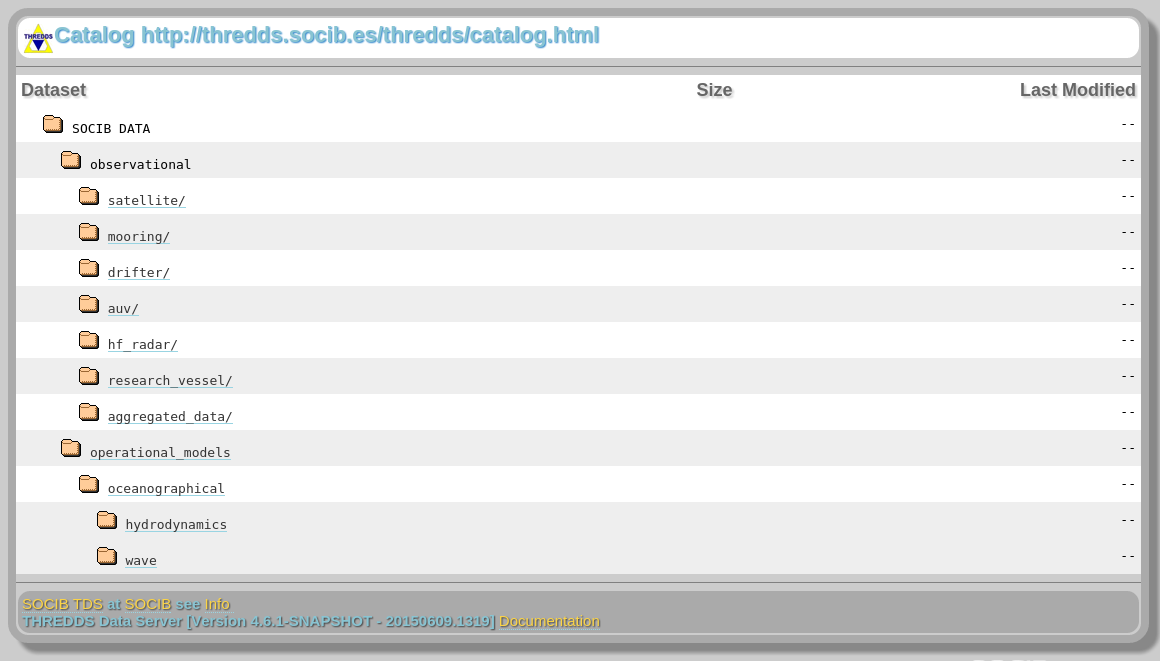
Data collected by SOCIB and forecasting data is in generally stored in NetCDF files, and distributed using THREDDS Data Server
Previous work: The Lightweight for NetCDF viewer (Lw4nc2)
IFrame('http://thredds.socib.es/lw4nc2/?m=radar&i18n=en_EN', width="100%", height=700)
- LW4NC2 is an application similar to Godiva that allows the user to browse through gridded files by variable or date. It also allows the user to extract time series at chosen locations, change styles and perform other visualization tasks.
- Developed using OpenLayers (v2)
- Two years ago we added a time animation control
- This is an app that we currently use at SOCIB, and it is quite complete. But we understand it covers only an specific use case. We wanted to embed map viewers in our websites, and we also needed animations for other kind of map layers, as geojson layers, to be able to animated trajectories of our mobile platforms.
- Before developing Leaflet.TimeDimension, we were showing in our website only the last available observation of our HF Radar facility.
hf_radar_map
- Now, we can show an animation of the observations, among other improvements (see http://www.socib.es/?seccion=observingFacilities&facility=radar)
hf_radar_time_map.add_children(twms)
- Or we can animate the trajectories of a bunch of surface drifters… This is the example of a campaign in the alboran sea. http://test.socib.es/en/facilities/observing-facilities/lagrangian-platforms/
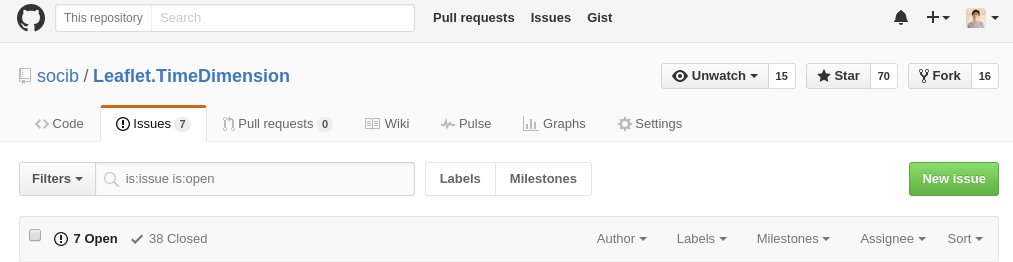
Leaflet.Timedimension contributions
Leaflet.Timedimension: basic code examples
Basic example with a WMS Layer:
var map = L.map('map', {
    timeDimension: true,
    timeDimensionControl: true,
});

var oceanForecastingWMS = "http://thredds.socib.es/thredds/wms/operational_models/oceanographical/hydrodynamics/model_run_aggregation/wmop/wmop_best.ncd";

var temperatureLayer = L.tileLayer.wms(oceanForecastingWMS, {
    layers: 'temp',
    format: 'image/png',
    transparent: true,
    styles: 'boxfill/sst_36'
});

var temperatureTimeLayer = L.timeDimension.layer.wms(temperatureLayer, {
    updateTimeDimension: true,
}).addTo(map);
Leaflet.Timedimension: basic code examples
Basic example with a GeoJSON Layer:
var map = L.map('map', {
    timeDimension: true,
    timeDimensionControl: true,
});

$.getJSON('data/example.geojson', function(data) {
    var geoJsonLayer = L.geoJson(data);

    var geoJsonTimeLayer = L.timeDimension.layer.geoJson(geoJsonLayer, {
        updateTimeDimension: true,
        duration: 'PT20M',
    });

    geoJsonTimeLayer.addTo(map);

    map.fitBounds(geoJsonLayer.getBounds());
});
Remarks about GeoJSON
According to GeoJSON specification, geometry coordinates can have only three dimensions: latitude, longitude and elevation.
So, there isn't a standard way to fill time dimension information in GeoJSON format.
Leaflet.TimeDimension searchs for these properties to get time information of each feature: time, times, coordTimes or linestringTimestamps
Leaflet.TimeDimension: create new timedimension layer types
TimeDimension.Layer is an abstract Layer that can be synchronized with a TimeDimension. The constructor recieves a layer (of any kind) and options.
The plugin is shipped with GeoJSON and WMS TimeDimension layers (seen before).
That classes can be extended, or you can create a new class than should implement at least this three methods: _onNewTimeLoading, isReady and _update
TimeDimension.Layer.CircleLabelMarker is an example of this (we will see later at example13)
Leaflet.TimeDimension: interact with time
var map = L.map('map', {
    timeDimension: true,
    timeDimensionControl: true,
});

// Modify the current time
map.timeDimension.setCurrentTime(new Date().getTime());

// Listen to timedimension events
// timeload: Fired when a all synced layers have been loaded/prepared for a new time (or timeout)
map.timeDimension.on('timeload', function(data) {
    // Example: update html elements when time is changed
    var currentDate = new Date(map.timeDimension.getCurrentTime()); // or data.time
    var dateElement = $("#date");
    dateElement.find('span.mapdate').html(currentDate.format("dd/mm/yyyy", true));
    dateElement.find('span.maptime').html(currentDate.format("HH:MM", true));
    dateElement.show();
});
Leaflet.Timedimension: basic code examples
Let's comment some examples from http://apps.socib.es/Leaflet.TimeDimension/examples/
Leaflet.TimeDimension meets folium!
- Folium is a Python package that allows you to manipulate your data in Python, then visualize it in on a Leaflet map via Folium.
import folium

geo_data = {
    "type": "FeatureCollection",
    "features": []
}

m = folium.Map([0, 3], zoom_start=2)
folium.GeoJson(geo_data).add_to(m)
m
import numpy as np
coordinates = [[[[lon-8*np.sin(theta), -47+6*np.cos(theta)] for
                 theta in np.linspace(0, 2*np.pi, 25)],
                [[lon-4*np.sin(theta), -47+3*np.cos(theta)] for theta
                 in np.linspace(0, 2*np.pi, 25)]] for
               lon in np.linspace(-150, 150, 7)]
geo_data = {
    "type": "FeatureCollection",
    "features": [
            {
                "type": "Feature",
                "geometry": {
                    "type": "Point",
                    "coordinates": [0, 0],
                    },
                "properties": {
                    "times": [1435708800000+12*86400000]
                    }
                },
            {
                "type": "Feature",
                "geometry": {
                    "type": "MultiPoint",
                    "coordinates": [[lon, -25] for
                                    lon in np.linspace(-150, 150, 49)],
                    },
                "properties": {
                    "times": [1435708800000+i*86400000 for
                              i in np.linspace(0, 25, 49)]
                    }
                },
            {
                "type": "Feature",
                "geometry": {
                    "type": "LineString",
                    "coordinates": [[lon, 25] for
                                    lon in np.linspace(-150, 150, 25)],
                    },
                "properties": {
                    "times": [1435708800000+i*86400000 for
                              i in np.linspace(0, 25, 25)]
                    }
                },
            {
                "type": "Feature",
                "geometry": {
                    "type": "MultiLineString",
                    "coordinates": [[[lon-4*np.sin(theta),
                                      47+3*np.cos(theta)] for theta
                                     in np.linspace(0, 2*np.pi, 25)]
                                    for lon in
                                    np.linspace(-150, 150, 13)],
                    },
                "properties": {
                    "times": [1435708800000+i*86400000 for
                              i in np.linspace(0, 25, 13)]
                    }
                },
            {
                "type": "Feature",
                "geometry": {
                    "type": "MultiPolygon",
                    "coordinates": coordinates,
                    },
                "properties": {
                    "times": [1435708800000+i*86400000 for
                              i in np.linspace(0, 25, 7)]
                    }
                },
        ],
    }
m = folium.Map([0, 3], zoom_start=2)
folium.GeoJson(geo_data).add_to(m)
m
from folium import plugins

m = folium.Map([0, 3], zoom_start=2)
tgj = plugins.TimestampedGeoJson(geo_data)
m.add_children(tgj)
import sys, os
sys.path.insert(0, '..')
import folium
from folium import plugins

m2 = folium.Map([0, 3], zoom_start=2)
tgj = plugins.TimestampedGeoJson(geo_data)
m2.add_children(tgj)
Leaflet.TimeDimension in use
HF RADAR: http://www.socib.es/?seccion=observingFacilities&facility=radar
WAVE FORECAST: http://www.socib.es/?seccion=modelling&facility=sapo
MEDCLIC PROJECT: http://medclic.es/en/instrumentos/modelado-y-prediccion/
NEW SOCIB WEBSITE (soon)